
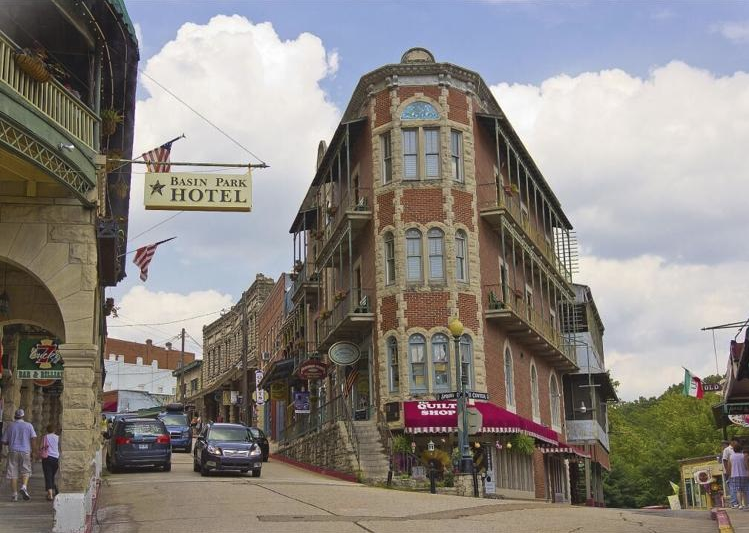
Stacker compiled a list of the counties with the highest unemployment rate in Indiana using data from the U.S. Bureau of Labor Statistics.
Counties with the highest unemployment rate in Indiana
Updated
Unemployment rates, while significantly lower than the alarming pandemic peak of 14.7% experienced in April 2020, remain a subject of concern, notably as economic experts bandy around the idea of a potential recession by 2023. The last economic recession—the Great Recession of 2008-2010—sent rates up to 10% as of October 2009. It was not until the spring of 2019 that unemployment finally went down to the same level it sits at now.
As of May of this year, national unemployment is at 3.6%—as it was in both March and April, marking a three-month stagnation—following a steady drop since that aforementioned COVID-affected peak. Seasonally adjusted unemployment rates by state demonstrate a rather sizable spectrum, ranging from just 1.9% in Nebraska and Utah, to 5.3% in New Mexico and 5.8% in the District of Columbia. Further breakdown by the U.S. Bureau of Labor Statistics shows yet another county-based spectrum within each state.
To that end, Stacker compiled a list of counties with the highest unemployment rate in Indiana using data from the BLS. Counties are ranked by unemployment rate in April 2022, which as of this writing is the most current Bureau data.
You may also like: Counties in Indiana where people spend most of their paycheck on housing

#50. Jefferson County
Updated
– Current unemployment rate: 1.86%
— 1 month change: -0.5%
— 1 year change: -1.5%
– Total labor force: 14,650 (272 unemployed)
#49. Tipton County
Updated
– Current unemployment rate: 1.87%
— 1 month change: -0.5%
— 1 year change: -0.9%
– Total labor force: 8,810 (165 unemployed)
#48. Morgan County
Updated
– Current unemployment rate: 1.89%
— 1 month change: -0.6%
— 1 year change: -1.3%
– Total labor force: 36,741 (694 unemployed)
#47. Clark County
Updated
– Current unemployment rate: 1.90%
— 1 month change: -0.8%
— 1 year change: -1.6%
– Total labor force: 62,829 (1,192 unemployed)
#46. Dearborn County
Updated
– Current unemployment rate: 1.91%
— 1 month change: -0.6%
— 1 year change: -1.3%
– Total labor force: 25,311 (483 unemployed)
You may also like: Counties with the worst commutes in Indiana
#45. Wabash County
Updated
– Current unemployment rate: 1.92%
— 1 month change: -0.6%
— 1 year change: -1.0%
– Total labor force: 14,361 (276 unemployed)
#44. Carroll County
Updated
– Current unemployment rate: 1.93%
— 1 month change: -0.7%
— 1 year change: -1.0%
– Total labor force: 9,774 (189 unemployed)
#43. Perry County
Updated
– Current unemployment rate: 1.93%
— 1 month change: -0.6%
— 1 year change: -1.3%
– Total labor force: 8,634 (167 unemployed)
#42. Jay County
Updated
– Current unemployment rate: 1.94%
— 1 month change: -0.6%
— 1 year change: -0.6%
– Total labor force: 8,439 (164 unemployed)
#41. Putnam County
Updated
– Current unemployment rate: 1.95%
— 1 month change: -0.6%
— 1 year change: -1.6%
– Total labor force: 16,590 (323 unemployed)
You may also like: Fastest-growing counties in Indiana
#40. Randolph County
Updated
– Current unemployment rate: 1.95%
— 1 month change: -0.7%
— 1 year change: -1.3%
– Total labor force: 12,075 (236 unemployed)
#39. Parke County
Updated
– Current unemployment rate: 2.01%
— 1 month change: -0.8%
— 1 year change: -1.3%
– Total labor force: 6,880 (138 unemployed)
#38. Pulaski County
Updated
– Current unemployment rate: 2.01%
— 1 month change: -0.6%
— 1 year change: -1.1%
– Total labor force: 6,361 (128 unemployed)
#37. Pike County
Updated
– Current unemployment rate: 2.05%
— 1 month change: -0.8%
— 1 year change: -1.5%
– Total labor force: 5,659 (116 unemployed)
#36. Noble County
Updated
– Current unemployment rate: 2.06%
— 1 month change: -0.5%
— 1 year change: -1.4%
– Total labor force: 21,019 (434 unemployed)
You may also like: Highest-rated specialty museums in Indiana, according to Tripadvisor
#35. Henry County
Updated
– Current unemployment rate: 2.12%
— 1 month change: -0.6%
— 1 year change: -1.2%
– Total labor force: 21,741 (460 unemployed)
#34. Vanderburgh County
Updated
– Current unemployment rate: 2.13%
— 1 month change: -0.6%
— 1 year change: -1.9%
– Total labor force: 93,087 (1,979 unemployed)
#33. Brown County
Updated
– Current unemployment rate: 2.15%
— 1 month change: -0.6%
— 1 year change: -1.6%
– Total labor force: 7,677 (165 unemployed)
#32. Fulton County
Updated
– Current unemployment rate: 2.17%
— 1 month change: -0.9%
— 1 year change: -1.5%
– Total labor force: 9,189 (199 unemployed)
#31. Lawrence County
Updated
– Current unemployment rate: 2.18%
— 1 month change: -0.6%
— 1 year change: -1.6%
– Total labor force: 20,622 (449 unemployed)
You may also like: Counties with the most veterans in Indiana
#30. Switzerland County
Updated
– Current unemployment rate: 2.19%
— 1 month change: -0.6%
— 1 year change: -1.7%
– Total labor force: 4,559 (100 unemployed)
#29. Cass County
Updated
– Current unemployment rate: 2.20%
— 1 month change: -0.8%
— 1 year change: -1.5%
– Total labor force: 16,980 (374 unemployed)
#28. Huntington County
Updated
– Current unemployment rate: 2.21%
— 1 month change: -0.2%
— 1 year change: -0.7%
– Total labor force: 17,978 (397 unemployed)
#27. Greene County
Updated
– Current unemployment rate: 2.23%
— 1 month change: -0.7%
— 1 year change: -1.5%
– Total labor force: 13,447 (300 unemployed)
#26. Jasper County
Updated
– Current unemployment rate: 2.25%
— 1 month change: -0.9%
— 1 year change: -1.6%
– Total labor force: 15,609 (351 unemployed)
You may also like: Cities with the fastest-growing home prices in Indiana
#25. Clay County
Updated
– Current unemployment rate: 2.25%
— 1 month change: -0.6%
— 1 year change: -1.7%
– Total labor force: 11,690 (263 unemployed)
#24. Wayne County
Updated
– Current unemployment rate: 2.26%
— 1 month change: -0.6%
— 1 year change: -1.6%
– Total labor force: 28,928 (653 unemployed)
#23. Jennings County
Updated
– Current unemployment rate: 2.26%
— 1 month change: -0.7%
— 1 year change: -1.8%
– Total labor force: 13,269 (300 unemployed)
#22. Owen County
Updated
– Current unemployment rate: 2.27%
— 1 month change: -0.8%
— 1 year change: -1.8%
– Total labor force: 9,521 (216 unemployed)
#21. Grant County
Updated
– Current unemployment rate: 2.27%
— 1 month change: -0.6%
— 1 year change: -1.5%
– Total labor force: 31,300 (712 unemployed)
You may also like: See how Indiana will be affected if Roe v. Wade is overturned
#20. Allen County
Updated
– Current unemployment rate: 2.30%
— 1 month change: -0.3%
— 1 year change: -1.8%
– Total labor force: 187,830 (4,315 unemployed)
#19. Porter County
Updated
– Current unemployment rate: 2.32%
— 1 month change: -0.7%
— 1 year change: -2.1%
– Total labor force: 84,510 (1,960 unemployed)
#18. St. Joseph County
Updated
– Current unemployment rate: 2.33%
— 1 month change: -0.6%
— 1 year change: -2.4%
– Total labor force: 132,081 (3,071 unemployed)
#17. Madison County
Updated
– Current unemployment rate: 2.39%
— 1 month change: -0.7%
— 1 year change: -2.2%
– Total labor force: 59,282 (1,415 unemployed)
#16. Crawford County
Updated
– Current unemployment rate: 2.40%
— 1 month change: -1.0%
— 1 year change: -1.5%
– Total labor force: 4,743 (114 unemployed)
You may also like: Recipes from Indiana
#15. Scott County
Updated
– Current unemployment rate: 2.41%
— 1 month change: -0.7%
— 1 year change: -1.7%
– Total labor force: 10,568 (255 unemployed)
#14. Newton County
Updated
– Current unemployment rate: 2.45%
— 1 month change: -1.0%
— 1 year change: -1.9%
– Total labor force: 6,583 (161 unemployed)
#13. Delaware County
Updated
– Current unemployment rate: 2.46%
— 1 month change: -0.6%
— 1 year change: -1.7%
– Total labor force: 52,907 (1,302 unemployed)
#12. Marion County
Updated
– Current unemployment rate: 2.47%
— 1 month change: -0.5%
— 1 year change: -2.6%
– Total labor force: 501,552 (12,401 unemployed)
#11. Orange County
Updated
– Current unemployment rate: 2.48%
— 1 month change: -0.9%
— 1 year change: -2.2%
– Total labor force: 7,971 (198 unemployed)
You may also like: Best places to raise a family in Indiana
#10. Blackford County
Updated
– Current unemployment rate: 2.52%
— 1 month change: -0.6%
— 1 year change: -1.6%
– Total labor force: 4,612 (116 unemployed)
#9. Vigo County
Updated
– Current unemployment rate: 2.57%
— 1 month change: -0.8%
— 1 year change: -2.2%
– Total labor force: 46,271 (1,187 unemployed)
#8. Sullivan County
Updated
– Current unemployment rate: 2.60%
— 1 month change: -0.9%
— 1 year change: -1.5%
– Total labor force: 8,009 (208 unemployed)
#7. Starke County
Updated
– Current unemployment rate: 2.66%
— 1 month change: -0.9%
— 1 year change: -2.1%
– Total labor force: 9,307 (248 unemployed)
#6. Vermillion County
Updated
– Current unemployment rate: 2.71%
— 1 month change: -0.8%
— 1 year change: -1.6%
– Total labor force: 6,595 (179 unemployed)
You may also like: Highest-rated Class of 2022 football recruits from Indiana
#5. Miami County
Updated
– Current unemployment rate: 2.81%
— 1 month change: -0.8%
— 1 year change: -1.6%
– Total labor force: 14,254 (400 unemployed)
#4. LaPorte County
Updated
– Current unemployment rate: 2.97%
— 1 month change: -0.9%
— 1 year change: -2.8%
– Total labor force: 46,311 (1,376 unemployed)
#3. Fayette County
Updated
– Current unemployment rate: 3.10%
— 1 month change: -0.7%
— 1 year change: -1.7%
– Total labor force: 7,991 (248 unemployed)
#2. Howard County
Updated
– Current unemployment rate: 3.82%
— 1 month change: -0.7%
— 1 year change: -2.0%
– Total labor force: 33,586 (1,283 unemployed)
#1. Lake County
Updated
– Current unemployment rate: 3.85%
— 1 month change: -0.8%
— 1 year change: -3.2%
– Total labor force: 224,893 (8,659 unemployed)
You may also like: Cities in Indiana with the most living in poverty
Leave A Comment